A for-sale-by-owner asking price is not evidence of value; the closed sales around it are. This northwest Jacksonville home was listed by its owner on Zillow just under $200,000, while six months of sales and attempted sales in the same neighborhood put a 1,206 sq ft house at a fair market value of $129,738 and a top of market of $157,828. Rounded to the nearest quarter point that is $125,000 on a bad day and $150,000 on a good one. The closest comparable sale — the same street, within 34 square feet — closed at $152,500 in July 2026 after being listed at $185,000. The as-is cash offer was $44,000: the $125,000 resale plan minus a $40,000 profit margin, $10,000 to make it retail-ready, and about $31,000 in costs of sale, holding and financing.
Real Offers · Northwest Jacksonville
1,206 sq ft home · priced off six months of sales and attempted sales in the same neighborhood
A for-sale-by-owner listed just under $200,000 in a neighborhood where the comps support $125,000 to $150,000. The scattergram, the closest comparable sale, the full cost of turning a house into money, and a $44,000 cash offer.
The address and the homeowner's name are never shown. Everything else — the condition, the comps, and the number — is exactly what happened.
The hyperlocal comp pull, the scattergram, why a just-under-$200,000 asking price is not transacting, the full cost of selling, and a $44,000 cash offer.
This one is not a distressed seller. It is an owner who listed his own house on Zillow just under $200,000 and has been waiting. The video exists to show him, with his own neighborhood’s numbers, why nothing is happening — and what each of his actual options pays.
The market here is healthy, which is the point. Over the last twelve months this neighborhood closed 17 sales against 12 that failed and 7 still for sale — a 47 percent chance of selling, about 4.9 months of inventory, a median of 53 days on market and a median sold-to-list ratio of 97 percent. Houses here sell, quickly, and close to asking. That removes the easy excuse: this listing is not sitting because the market is frozen. It is sitting because of the number on it.
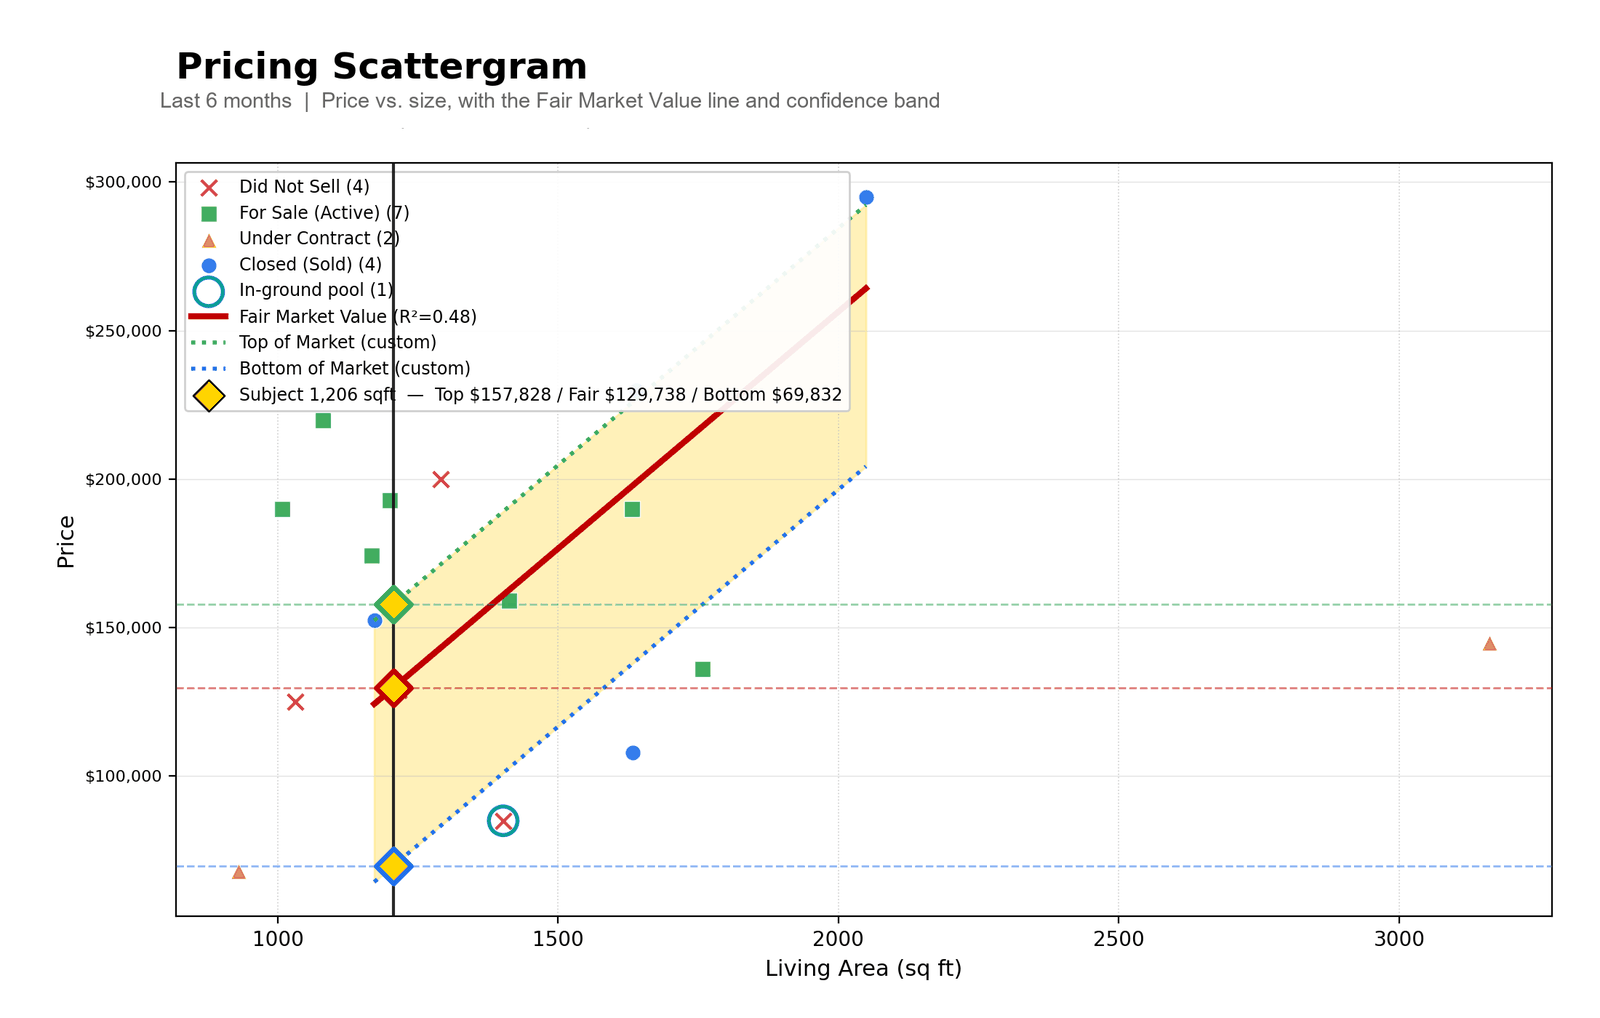
What the scattergram says. Plotting every sale and attempted sale from the last six months against square footage puts the subject’s 1,206 sq ft at a fair market value of $129,738 and a top of market of $157,828. The R² is 0.48, so size explains a little under half of what separates these prices and condition explains most of the rest — which is why the individual closed sales matter as much as the line. Both figures get rounded to the nearest quarter point and rounded down: $150,000 on a good day, $125,000 planning for a bad one.
The comp that settles it. A house on the same street, 1,172 sq ft — within 34 square feet of the subject — was listed at $185,000 and closed in July 2026 at $152,500, about 82 percent of its asking price. That is the nearest thing to an identical property that has actually changed hands, and it lands almost exactly on the top-of-market line. A $200,000 asking price is roughly $47,000 above what the closest real sale produced.
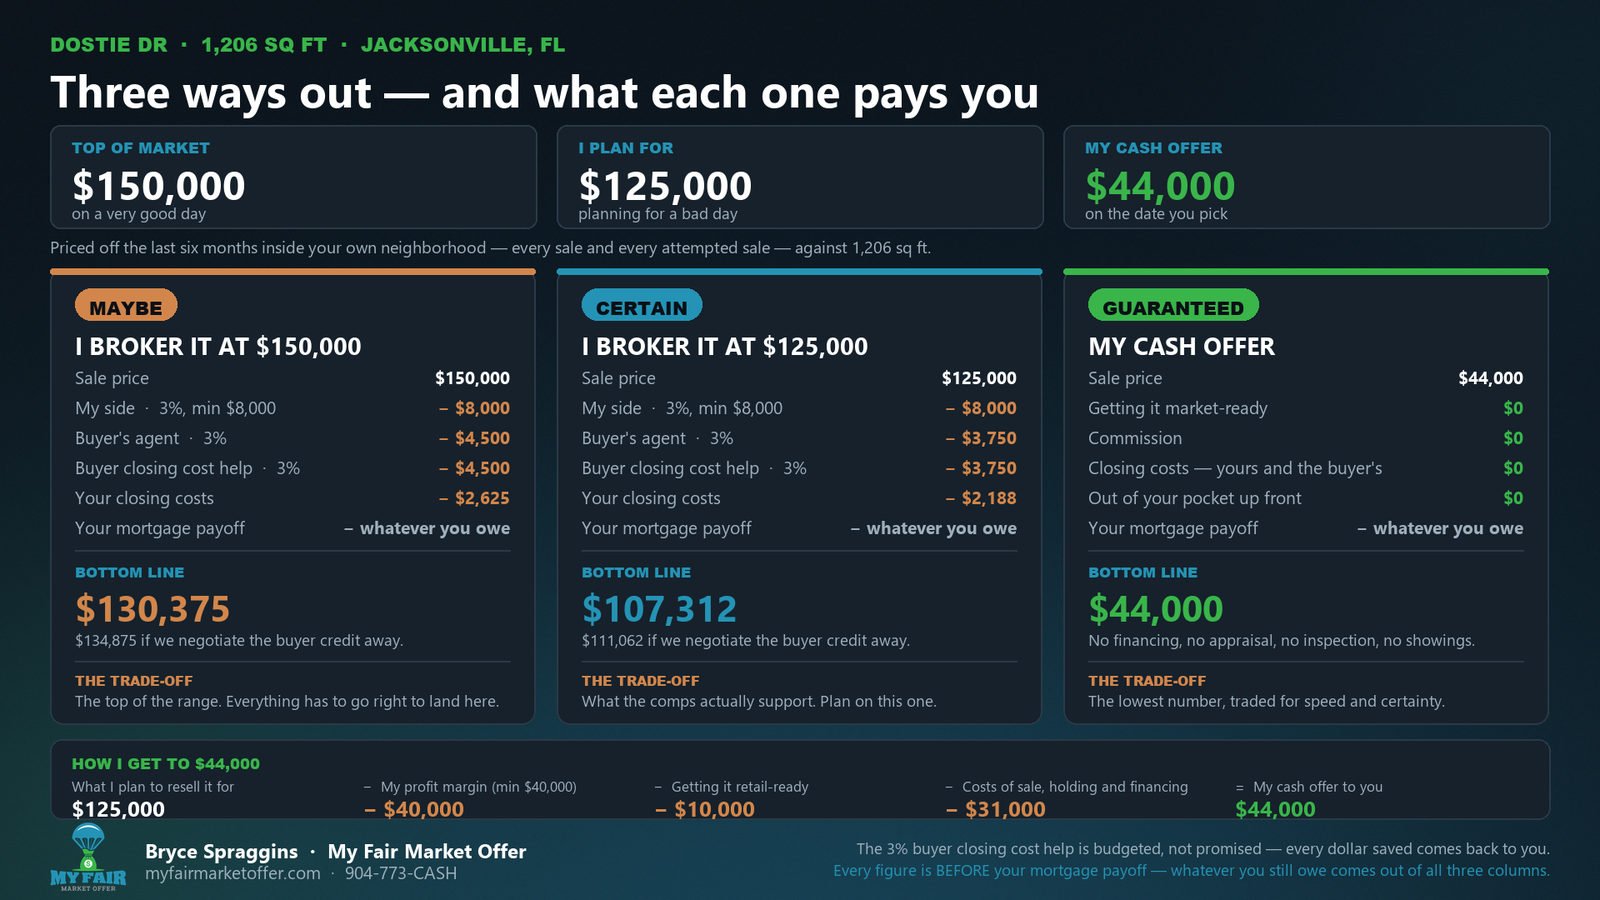
What it costs to turn a house into money. Getting $125,000 to $150,000 is not the same as keeping it. There is prep, staging and professional photography before it goes on the MLS, and in this market a buyer is going to ask for help with closing costs. At $150,000 the listing side, the buyer’s agent, that buyer credit and the seller’s own closing costs come to about 13 percent, leaving roughly $130,375. At $125,000 the same stack is about 14 percent — the fixed minimum commission is a bigger share of a smaller price — leaving roughly $107,312. Both figures are before any mortgage payoff.
The cash offer, built in the open. Start at the $125,000 resale plan. Take out the $40,000 profit margin a cash home buyer has to hold on a low-price deal, $10,000 to make it retail-ready, and about $31,000 in costs of sale, holding and financing on the resale end. That lands at $44,000, closing on whatever date the seller picks, with nothing to fix, clean or show.
And the option nobody offers him. If the price is the thing he will not move on, owner financing is the honest route to a higher one — because a seller carrying the note is selling a monthly payment rather than a price, and a buyer who cannot qualify at a bank will pay more for terms they can actually get. It is a different structure with a different set of risks, and it is the only way the number he wants and the number the market supports can both be true.
These are the real charts this offer was priced from — not a re-creation.
Almost always the price, and the way to prove it is the closed sales rather than the active ones. Other asking prices tell you what sellers hope for; only closed sales tell you what buyers paid. In this northwest Jacksonville neighborhood 17 homes closed in twelve months at a median 97 percent of asking and a median 53 days on market, so homes priced correctly are selling quickly. A listing sitting in a market like that is not waiting for a buyer — it is priced above where buyers are transacting. The closest comparable sale to this home, on the same street and within 34 square feet, closed at $152,500 against an asking price just under $200,000.
Pull every sale and every attempted sale in your immediate neighborhood for the last six months, plot them against square footage, and read your own size off the resulting line. Attempted sales matter as much as closed ones, because they show the prices buyers refused. Then check the closest comparable sale by size and condition, because a trend line rarely explains more than half the variation in price — on this property the R-squared was 0.48, meaning square footage accounted for under half of what separated these prices and condition accounted for most of the rest.
Usually yes, because the buyer stops shopping on price and starts shopping on the monthly payment and the down payment. A buyer who cannot qualify for a bank loan will pay above market for terms they can actually get, so a seller carrying the note can often ask more than a cash sale or a conventional listing would bring. The trade is time and risk: instead of one check at closing the seller receives a down payment, a monthly payment stream, and usually a balloon payment years later, and the seller carries the risk that the buyer stops paying.
More than the commission. Plan on the listing side, the buyer’s agent, help with the buyer’s closing costs and the seller’s own closing costs — on this property that stack came to about 13 percent at a $150,000 sale price and about 14 percent at $125,000, because a fixed minimum commission is a larger share of a smaller price. Separately, before it ever reaches the market, there is prep, staging and professional photography so the listing syndicates well. None of that is deducted from the asking price in a seller’s head, and all of it comes off at the table.
Because the two numbers answer different questions. A listing price is what the property might fetch after it is prepped, staged, photographed, marketed and shown, minus everything that comes off at closing, months later, with no guarantee. A cash offer is what is left once a buyer absorbs all of that work, cost and risk in advance and pays on the seller’s date. On this home the resale plan was $125,000 and the cash offer was $44,000 — $40,000 of the gap is the profit margin, $10,000 is making it retail-ready, and roughly $31,000 is the cost of sale, holding and financing on the way back out.
Tell us about the house and you'll get a real as-is cash offer to purchase your home — no repairs, no showings, no commissions. Same process, same honesty, and you'll hear the number out loud.
Bryce will be there. You'll receive a calendar invite shortly.