Home Values

How Much Is My House Worth? Why It's a Range, Not a Number

Published by Bryce Spraggins on

A house is worth a range, not a single number. The way to find that range is to take every sale and every failed attempt to sell in the smallest area around the house that still gives real data, plot price against living area, and read three lines off it: a fair market value line through the middle, and a top and bottom of market one standard deviation either side. On a tight neighbourhood with consistent homes that band can be $19,000 wide on a $276,000 house. On a thin one the math can fail outright. The chart tells you the range; condition, the features the neighbourhood expects, and how closely the house matches the homes that actually sold decide where inside that range it lands.

What a house is actually worth, shown with three real Jacksonville-area pricing scattergrams — one where the math works, one where it fails, and one where the house is too big for its own comparable sales.

What This Video Covers

“How much is my house worth?” has an honest answer and a comfortable one. The comfortable answer is a single number. The honest answer is a range — and then a judgement about where inside that range a specific house belongs. This video shows both halves with real Jacksonville-area neighbourhoods, priced on camera.

The science half: what the data can actually tell you

Real estate is hyperlocal, so the map gets drawn as tightly around the house as possible — and only widened until there is enough data to see a market. Then every closed sale and every attempt to sell goes onto one chart, price against living area. Three lines come off it: a fair market value line through the middle of the sales, and a top of market and bottom of market one standard deviation either side of it.

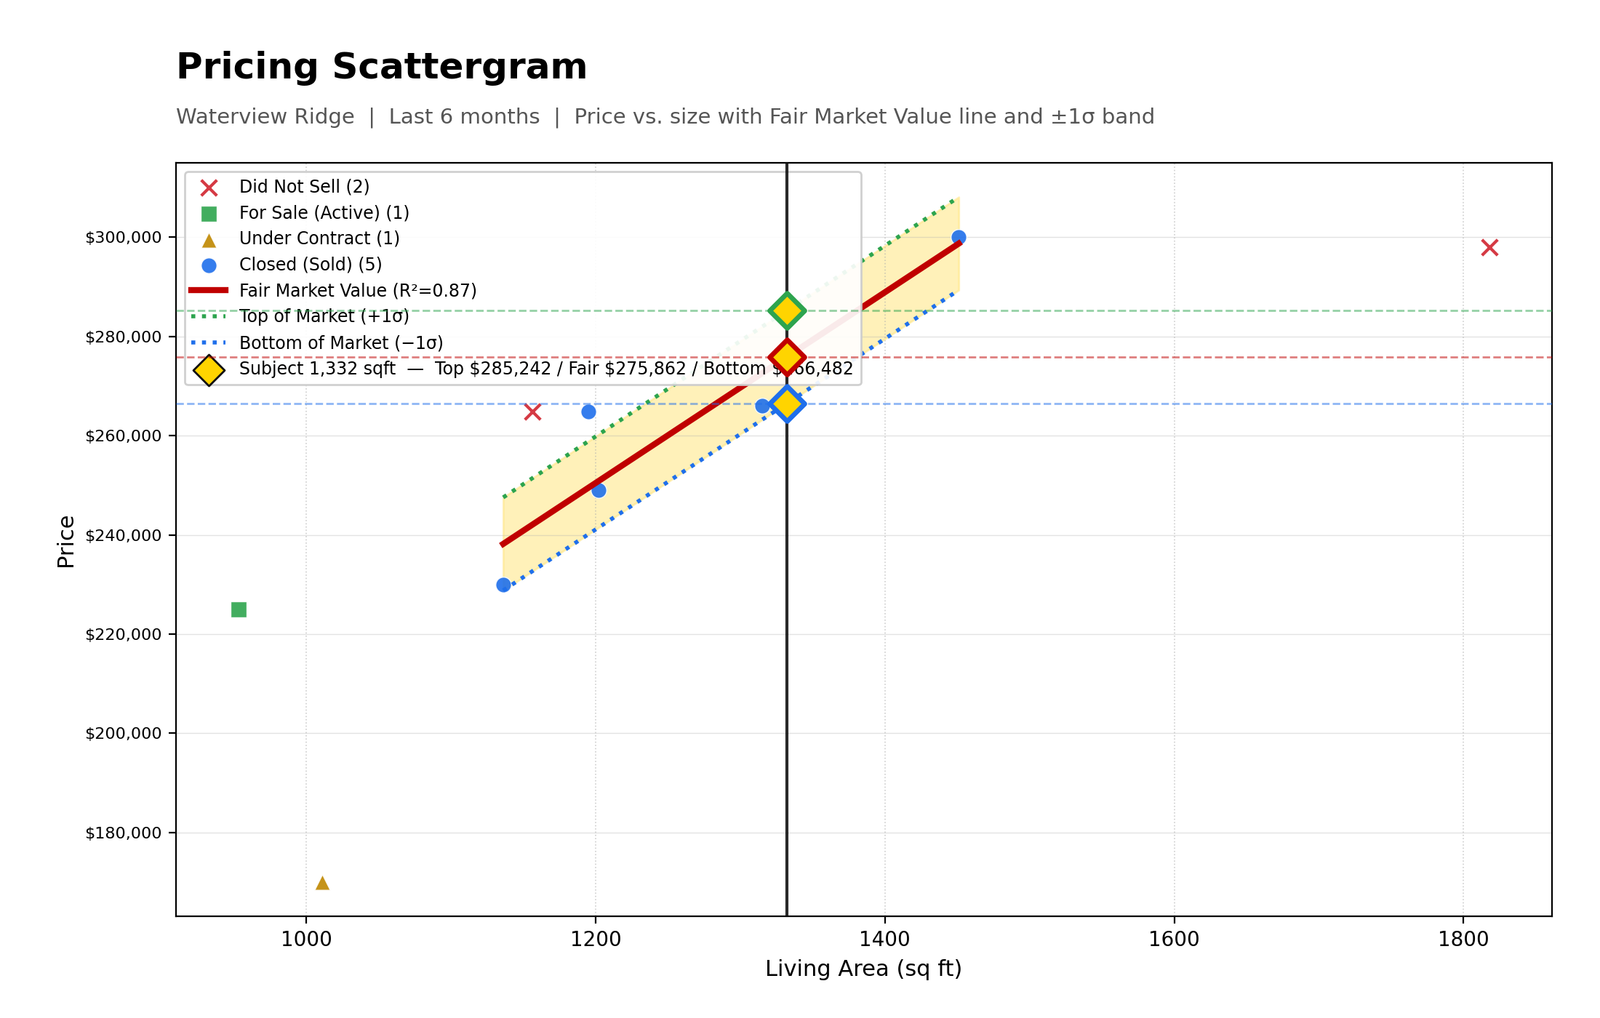
When a neighbourhood cooperates, this is genuinely powerful. In Waterview Ridge, five homes closed in six months, all of them between 1,136 and 1,451 square feet — a tight, consistent group. The fit came back at R² = 0.87, meaning square footage alone explains about 87% of the price difference between those houses. For a 1,332 square foot home the band ran $266,482 to $285,242, with fair market value at $275,862. That is a total spread of about $19,000 on a $276,000 house. Roughly seven percent. That is the math doing real work.

The art half: three ways the chart stops being trustworthy

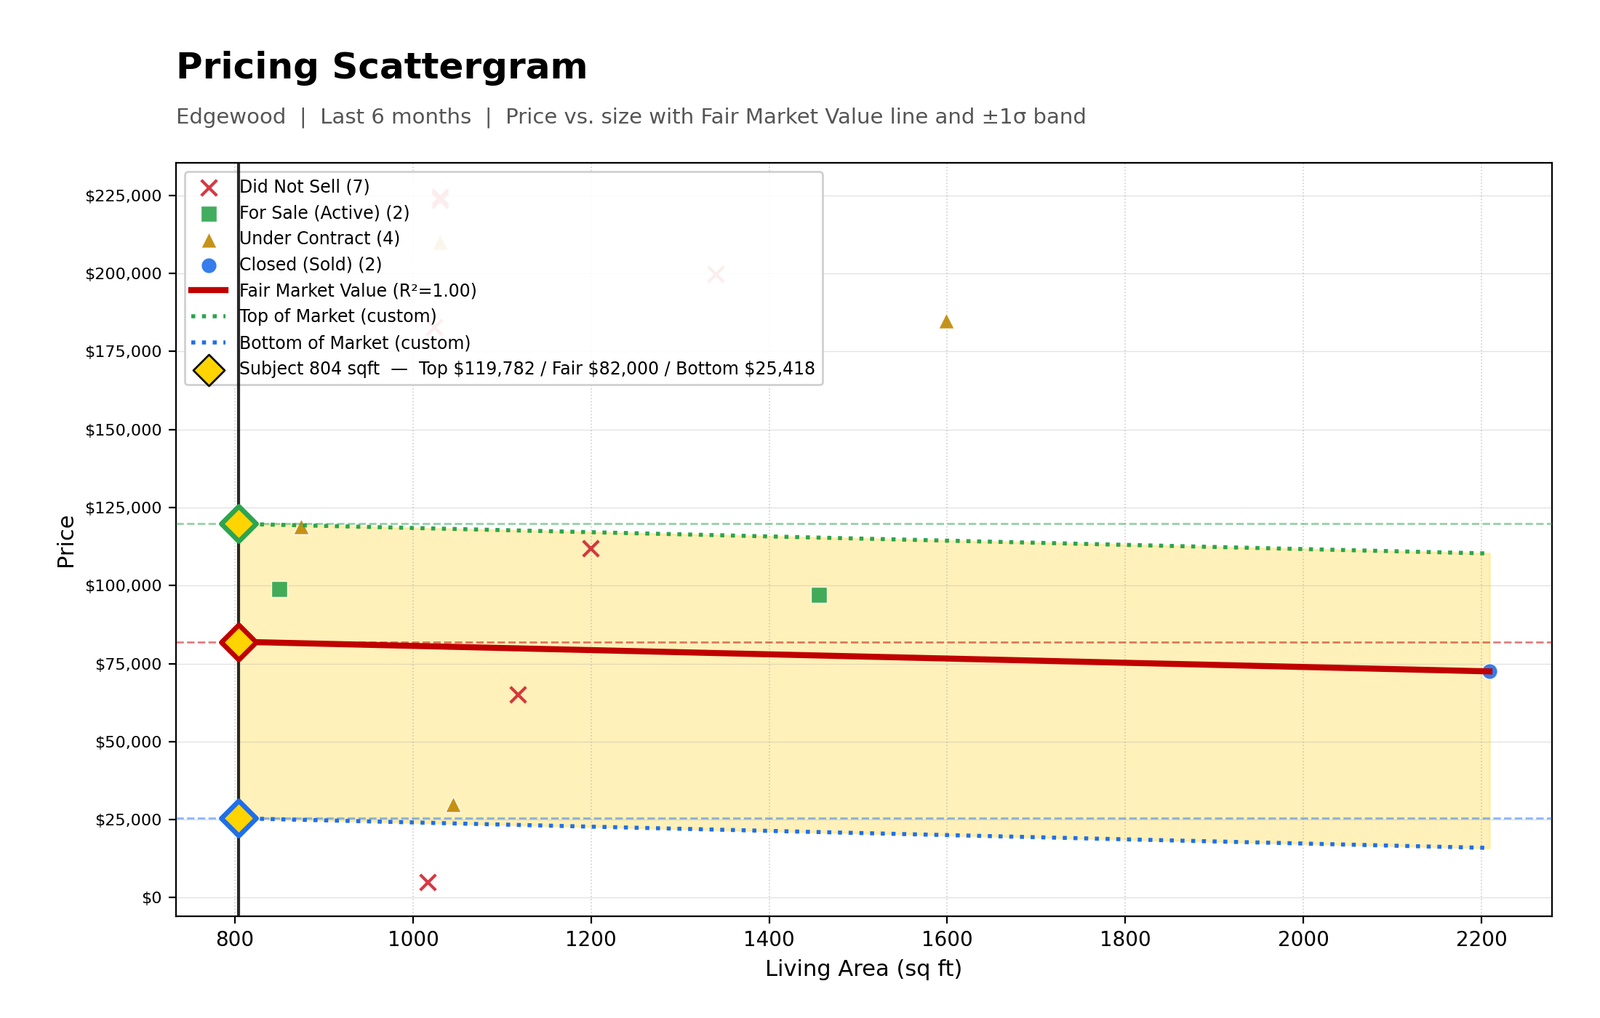
Not enough sales. Edgewood had exactly two closed sales in the window. Two points define a straight line perfectly, so the fit reported R² = 1.00 — a perfect score that means nothing at all. The standard deviation came back as literally zero, so the computed band had no width and had to be set by hand. The slope also ran downward: taken at face value the line says bigger houses there sell for less. Three brand-new construction homes that sold for around $250,000 in a small new-build pocket also had to be pulled out of the set, because they were not fair comparisons for a much older house. That single decision moves the answer more than any statistic on the chart.

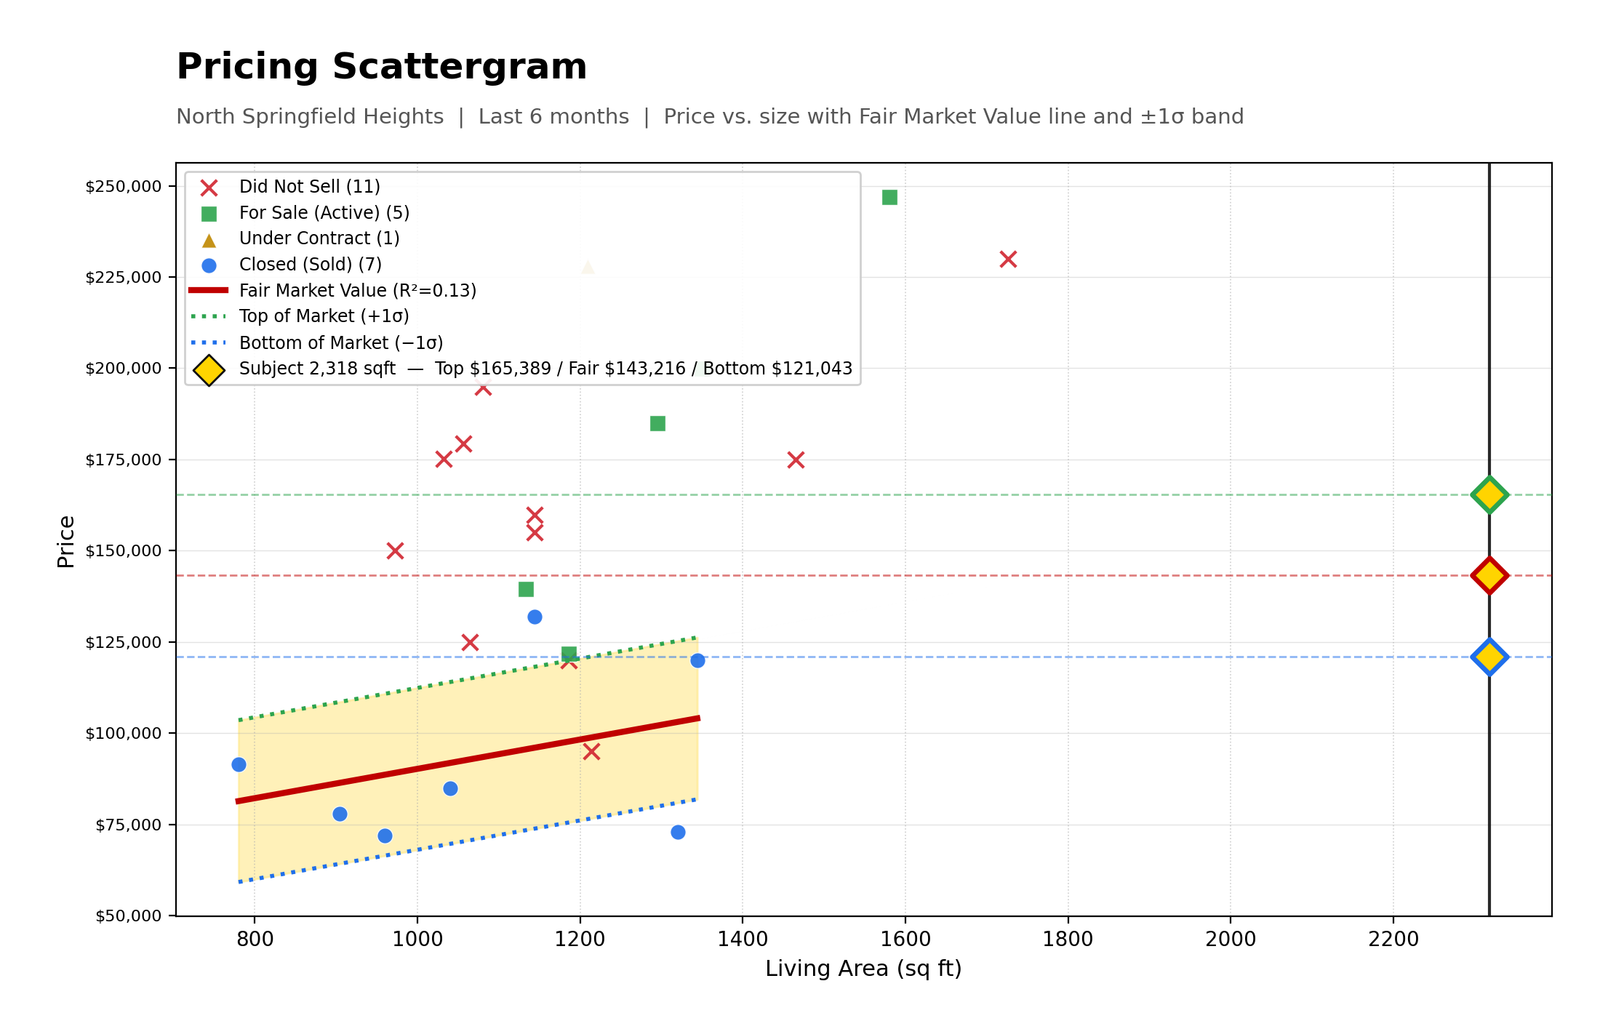
Sales that do not agree with each other. North Springfield Heights had seven closed sales and a fit of R² = 0.13 — size explains about thirteen percent of price. Everything else is condition, street and finish. A line drawn through data like that is a suggestion, not a valuation.

A house that is bigger than its own comps. In that same neighbourhood the subject was 2,318 square feet while the largest home that actually closed was 1,344. The line still prints a number out at 2,318 — $143,216 — but it is extrapolating well past its own data, and a number produced outside the range of the evidence is an artifact, not a ceiling. That is the point at which a person has to make the call. The honest read was $175,000, with $200,000 reachable only by setting a new high for the area rather than matching one.

Why even the good chart got overruled

Here is the part that matters most, and it happened on the best of the three. Waterview Ridge had the clean fit, the tight band, and the subject sitting right in the middle of its comparable sales — and the number still came down. Fair market value said $275,862. The call was $275,000 on a good day, $250,000 on a bad one, and plan on $250,000.

Two reasons, neither of which appears anywhere on the chart. First, the garage had been converted into living space. That trade adds square footage, which the line rewards — but in a neighbourhood where the competing homes all have garages, the buyer notices the missing garage before they notice the extra room. In this case it did not add value, and it may well have cost some. Second, stair-step cracks showed on nearly every corner of the house. Correcting a corner normally takes two pylons at roughly $5,000 each, and there were about twelve to do — call it $35,000 to $60,000 before anything else gets touched. A chart cannot see either of those things.

What actually decides where you land in the band

Condition. Presentation. Whether the house has the features the neighbourhood expects — a garage in a street of garages, a pool where every comparable sale has one. Whether it is the same kind of house as the ones that sold. And how deep the market is underneath it: in Waterview Ridge homes closed at a median 98.2% of asking price in about 51 days with only 1.2 months of standing inventory, while North Springfield Heights ran 95.7% of asking across 3.9 months of inventory. The same house is worth measurably more in the first one.

So the practical answer to “how much is my house worth” is this: get the band from the sales, then be honest with yourself about condition and about what your neighbourhood expects. Anyone who gives you a single number without walking the house is quoting you the middle of a range and hoping you do not ask.

Three Real Scattergrams: One That Works, Two That Don't

Pricing scattergram for Waterview Ridge showing five closed sales between 1,136 and 1,451 square feet, an upward fair market value line with an R-squared of 0.87, and a subject home at 1,332 square feet valued between $266,482 and $285,242
The math working — Waterview Ridge. Five closed sales, all between 1,136 and 1,451 square feet. The fit is R² = 0.87, so size alone explains about 87% of the price difference between these homes, and the subject at 1,332 sq ft sits in the middle of its own comparable sales rather than off the end of them. Fair market value reads $275,862, with top of market $285,242 and bottom $266,482: a band about $19,000 wide, roughly seven percent. This is as good as a neighbourhood chart gets — and the working number still came down to $250,000, because the garage had been converted in a street full of garages and the corners showed stair-step cracks. The chart cannot see either. (Click to enlarge.)
Pricing scattergram for Edgewood in Jacksonville with only two closed sales, a downward-sloping fair market value line with an R-squared of 1.00, seven unsold listings, and a subject home at 804 square feet
A perfect score that means nothing — Edgewood. Only two homes closed here in the window, and two points always define a straight line exactly — so the fit reports R² = 1.00 while proving nothing. The standard deviation is literally zero, so the band had to be set by hand rather than calculated. Read the slope literally and it says larger homes here sell for less. Three brand-new construction homes that sold around $250,000 in a small new-build pocket were also removed from the set as unfair comparisons for a much older house — a judgement call that moves the answer more than anything the statistics say. The bottom of market prints at $25,418, a good demonstration that a computed number is not automatically a meaningful one. (Click to enlarge.)
Pricing scattergram for North Springfield Heights showing seven closed sales between 780 and 1,344 square feet, eleven unsold listings, a nearly flat fair market value line with an R-squared of 0.13, and a subject home at 2,318 square feet far outside the range of the comparable sales
A house bigger than its own comps — North Springfield Heights. Seven closed sales and a fit of R² = 0.13, so square footage explains about thirteen percent of price here and the line is a suggestion rather than a valuation. Worse, every closed sale falls between 780 and 1,344 square feet while the subject is 2,318. The line still prints $143,216 out at that size, but it is extrapolating far past its own evidence. Note the wall of red crosses at $150,000 to $230,000: those are homes that tried to sell in that range and did not. The honest read for this house was $175,000, with $200,000 reachable only by setting a new high for the area. (Click to enlarge.)

Common Questions

How much is my house worth?

A house is worth a range rather than a single figure. The range comes from plotting every recent sale and every failed attempt to sell near the property against living area, then reading a fair market value line and a top and bottom of market one standard deviation either side. In a consistent neighbourhood that range can be as narrow as about seven percent of the price; in a thin or inconsistent one it can be far wider. Where a specific house lands inside that range is decided by condition, by whether it has the features the neighbourhood expects, and by how closely it resembles the homes that actually sold.

What is a pricing scattergram in real estate?

A pricing scattergram plots every sale and every attempt to sell in a defined area, with living area on one axis and price on the other. A regression line through the closed sales gives fair market value, and lines one standard deviation above and below give the top and bottom of the market. Because failed listings are plotted alongside successful ones, it also shows what a market refused to pay, not only what it paid.

How many comparable sales do you need to price a house?

Enough that the sales can disagree with each other. Two sales will always produce a perfect-looking straight line and a statistical fit of 1.00, which proves nothing, and the calculated market band collapses to zero width. Five to seven closed sales of genuinely similar homes in the immediate area is where the numbers start to mean something, and the sales need to bracket the subject property in size.

Why can a home valuation be wrong if the house is unusually large?

Because the valuation line only knows the range of homes it was built from. If every comparable sale falls between 780 and 1,344 square feet and the house being valued is 2,318, the line has to extrapolate beyond its own evidence, and the figure it produces out there is an artifact rather than a real ceiling. In that situation the number has to come from judgement about the local market, not from the formula.

Does converting a garage into living space increase a home's value?

Not reliably, and it can reduce value. The conversion adds finished square footage, which a size-based valuation rewards, but in a neighbourhood where the competing homes all have garages the buyer weighs the missing garage against the extra room. When the surrounding comparable sales have garages, a converted garage commonly nets out at zero added value or slightly negative.

Is a county assessed value the same as market value?

No. An assessment is a figure the property appraiser sets for tax purposes, while market value is what a buyer will actually pay. They are often close and the assessment is usually the lower of the two, but not always — where a neighbourhood has deep unsold inventory an assessment can sit well above what a property will really sell for.

Related Resources

Want a Cash Offer?

Fill out the form and Bryce will review the property.